By Devin Vodicka
I love my Toyota Prius. In addition to feeling good about the fuel efficiency, the interior dashboard displays are customizable and they provide an array of visuals and numeric data that help me to understand how fast I am going, how much fuel I am using, and how efficiently I am driving. There are GPS maps, a compass, and integration with apps that can tell me the weather, the daily news, and all sorts of other information. As a self-described “data nerd,” I absolutely love the balance of simple design with complex engineering.
The challenge for a driver like me is to remember that all of these dashboard displays are not the destination. I need to keep my focus on where I am going and pay attention to the road. It would be possible, for example, to optimize all of the gauges by driving very slowly in circles and that would not help me to make any meaningful progress.

Unfortunately, optimizing on the dashboard displays is what we’ve been doing in education for quite some time. Even worse, the education version of a dashboard display has been showing just one or two metrics (test scores and/or grade-point-averages) which may not be visualizing trade-offs that are inherent on the journey. When I accelerate as a driver, my speed improves and my fuel efficiency gets worse. When we optimize around test scores, research shows that we ought to be considering the overall impact on the whole-learner:
“… test scores have often been found to have a negative correlation with students’ confidence and well-being (Loveless 2006; OECD 2019; Zhao 2018b). Test scores have also been found to have a negative correlation with economic development and entrepreneurial confidence and activities (Baker 2007; Tienken 2008; Zhao 2012). Test scores do not predict the future of an individual’s success very well, and non-cognitive skills may play a bigger role than cognitive skills play (Brunello and Schlotter 2010; Levin 2012).”
https://nepc.colorado.edu/blog/new-article
To be clear, I am not opposed to using standardized tests. I just believe that the hyperfocus on those results would be like if the only gauge on your car dashboard was the speedometer. We need a more holistic approach.
The solution here requires two very important steps, each of which are imperative during times of rapid change.
- First, we need to know where we are going which requires a clear articulation of our shared vision for the future.
- Second, we need to respectfully interrogate the gap between our current reality and the desired future and then identify a select number of markers that will indicate if we are making progress.
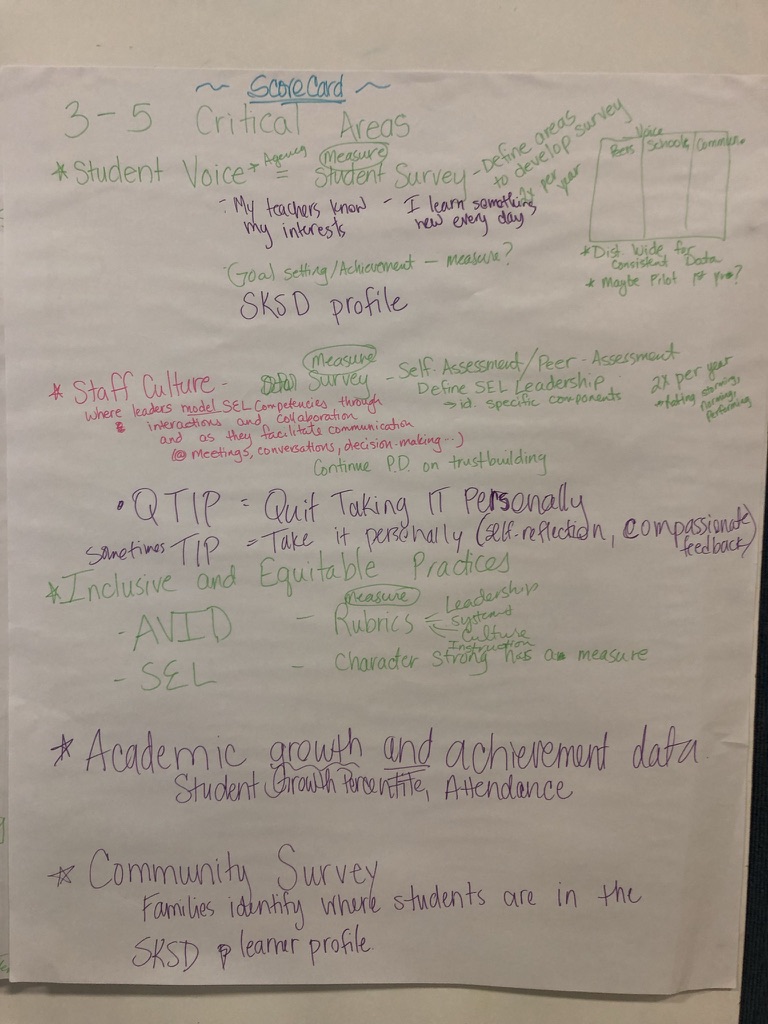
In South Kitsap School District (Washington), we’ve been working with a guiding coalition to navigate through this process. We began with a review of their vision, mission, values, and their Priority Plan. Collaboratively, we connected their learner profile to a set of outcomes and competencies. During our recent visit, we went through a “Back to the Future” protocol to gain collective clarity on the desired future and the gaps between current reality. All of this informed the development of a South Kitsap Scorecard that will be used to guide conversations about progress.
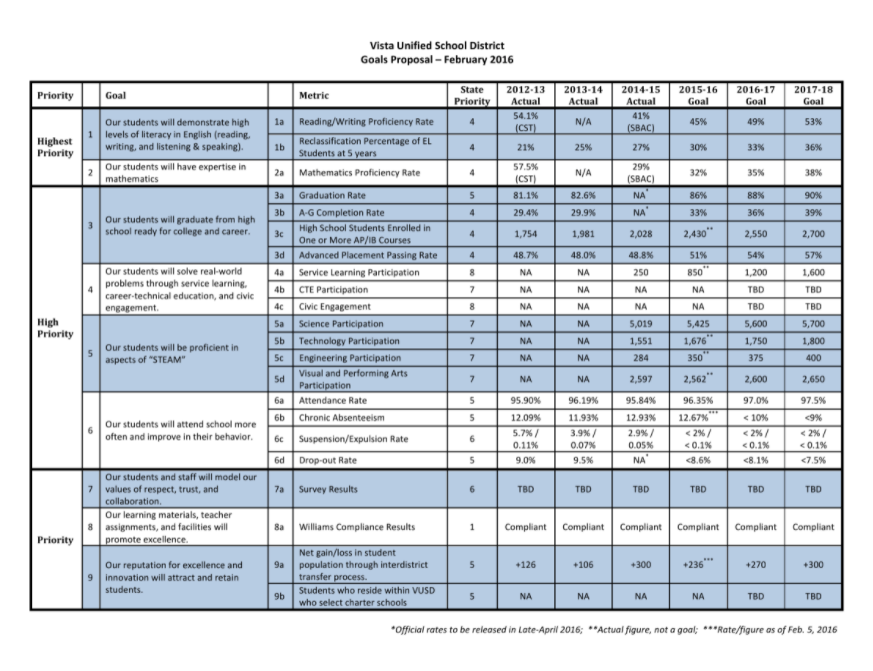
In Learner-Centered Leadership, I describe a similar process that we used in Vista Unified School District:
In addition to measures of student learning, we also included goals that related to our Framework for the Future. We ensured that we measured levels of respect, trust, and collaboration through surveys of students, families, and staff to show critical alignment with our values. We also measured “real-world problem solving” (through participation in service-learning projects, career technical education, and applied science and social studies courses), which was such an important part of our mission. In terms of our vision, we felt that attracting and retaining students was a good measure of our reputation for excellence and innovation. In cases where measurements did not exist, we developed metrics that made sense and used those as baselines to gauge progress.
The key step here that is often missed is to first be clear about the vision. With that vision in place, a thoughtful and informed approach to creating the dashboard scorecard becomes possible. For more suggestions about how to go through this process, be sure to check out this blog post.
We need to be clear on where we are going. This requires time and effort to ensure that we are clear on our shared vision for the future. To guide our journey, we need to identify markers that will help us to know if we are making progress.
In other words, let’s lift up our gaze and focus on the horizon first to set our destination. Next we can customize the dashboard displays to give us the most information that we can reference on the journey. Our students, staff, and communities are depending on us.
Check out the book Learner-Centered Leadership: A Blueprint for Transformational Change in learning Communities for more insights, reflections, and suggestions.
Use #LCLeadership to share your ideas
Click here to sign up for the Learner-Centered Leadership email list
